America's most (and least) deal-obsessed cities: A study of 12.4 million coupon sessions
We analyzed 12.4 million coupon search sessions to rank America's 50 largest cities by how often shoppers actually use the deals they find.
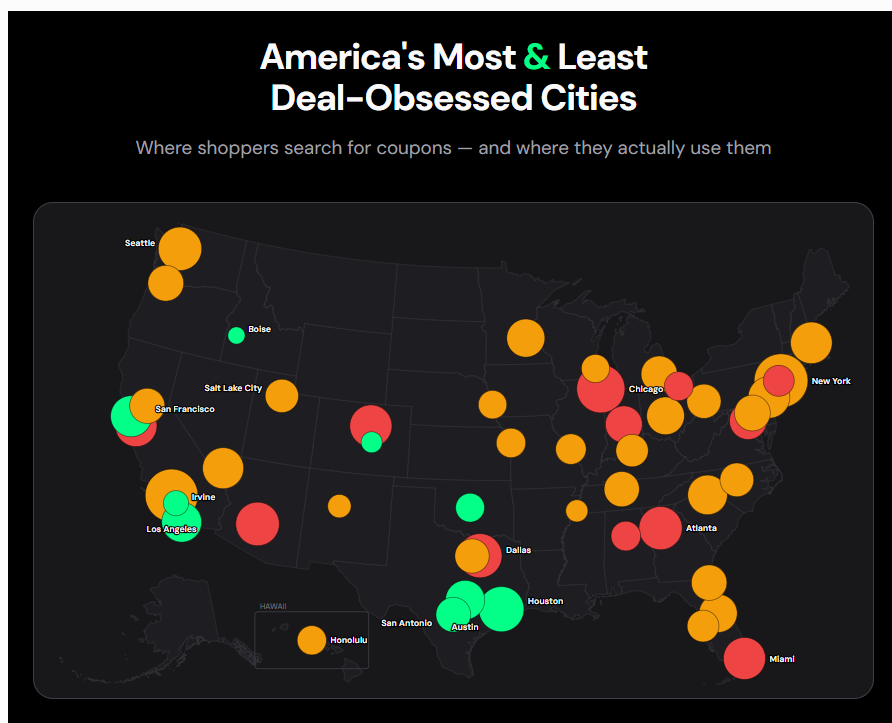
Every day, millions of Americans search for coupon codes before completing an online purchase. But not every city shops the same way. mycouponstock analyzed 12.4 million coupon search sessions across more than 10,000 U.S. cities to find out where Americans hunt for deals the hardest — and where they barely bother at all.
The results reveal a striking divide in American shopping behavior. Some cities don't just search for codes — they copy them at checkout more than half the time. Others browse at massive scale but are far less likely to actually use what they find. And when you adjust for population, the cities that punch the hardest aren't always the ones you'd expect.
To rank America's cities, we tracked every coupon search session on mycouponstock from November 2025 through March 2026 and measured three things:
- Coupon sessions: The total number of browsing visits to a store’s coupon page. Each session represents one person, in one sitting, looking for a deal. A single user who visits three times in a week counts as three sessions. This is our measure of demand — how much deal-seeking activity a city generates.
- Code copies: The number of times a user actually copied a promo code to their clipboard — the last step before pasting it at checkout. This is our measure of intent — not just browsing, but grabbing a code to use.
- Copy rate: The percentage of sessions where a user copied at least one code. A city with a 55% copy rate means that in more than half of all coupon visits, the shopper left with a code in hand. This is our measure of commitment — how often searching translates to action.
The national average copy rate sits at 50.7%, meaning roughly half of all coupon searches end with a code copied. Cities above that line are deal-closers. Cities below it are window shoppers.
Key findings:
- New York leads in raw volume with over 500,000 coupon sessions, but its copy rate (51.3%) is only slightly above average.
- Texas is the most deal-obsessed state, placing four cities in the top 10 by copy rate — led by San Antonio (53.2%) and Austin (52.7%).
- Irvine, California has the highest copy rate in the country at 55.1%, more than 10 percentage points above the least engaged major city.
- Miami is the least deal-committed major metro, with a copy rate of just 43.7% despite ranking 10th in total search volume.
The cities that search for deals the most
The 15 cities with the highest coupon search volume are, unsurprisingly, America's largest metros. But raw volume only tells part of the story. When you look at how often those searchers actually copy a code to use at checkout, clear divides emerge — even among cities of similar size.
| RANK | CITY | SESSIONS (HOW MANY VISITS TO A COUPON PAGE) | CODE COPIES (HOW MANY PEOPLE COPIED CODES) | COPY RATE (PERCENTAGE OF PEOPLE WHO COPIED ONE CODE WHILE ON COUPON PAGE) |
|---|---|---|---|---|
| 1 | New York, NY | 500,998 | 626,095 | 51.3% |
| 2 | Los Angeles, CA | 418,966 | 477,808 | 49.1% |
| 3 | Chicago, IL | 202,929 | 237,552 | 48.7% |
| 4 | Houston, TX | 128,650 | 168,378 | 52.3% |
| 5 | Dallas, TX | 111,104 | 126,834 | 47.4% |
| 6 | Phoenix, AZ | 102,789 | 114,187 | 48.7% |
| 7 | Seattle, WA | 101,431 | 121,951 | 50.3% |
| 8 | Atlanta, GA | 98,538 | 112,648 | 48.2% |
| 9 | Denver, CO | 85,651 | 95,813 | 48.9% |
| 10 | Miami, FL | 84,230 | 91,432 | 43.7% |
| 11 | San Jose, CA | 80,332 | 97,244 | 48.1% |
| 12 | Philadelphia, PA | 79,860 | 99,581 | 51.5% |
| 13 | Boston, MA | 79,041 | 91,235 | 49.8% |
| 14 | Las Vegas, NV | 73,756 | 88,582 | 50.9% |
| 15 | San Francisco, CA | 73,667 | 93,559 | 52.1% |
New York generates the most coupon search traffic in the country by a wide margin — over 500,000 sessions and more than 626,000 code copies since November 2025. That's roughly 20% more activity than second-place Los Angeles. But New York's copy rate of 51.3% is only modestly above the national average of 50.7%, suggesting that while the city's sheer population drives enormous search volume, New Yorkers aren't necessarily more committed to closing the deal than the rest of the country.
The most interesting story in the top 15 is the gap between Houston and Dallas. Despite being in the same state and separated by only about 17,000 sessions, the two Texas metros behave very differently at checkout. Houston shoppers copy codes in 52.3% of sessions — the highest intensity of any top-15 city. Dallas, meanwhile, posts a 47.4% copy rate. Houston doesn't just search for deals more often; its shoppers try more codes per visit, suggesting a more determined, price-conscious consumer.
Then there's Miami. The city ranks 10th in total volume — ahead of Philadelphia, Boston, and San Francisco — but dead last among the top 15 in copy rate at just 43.7%. That's nearly 7 percentage points below the national average. Miami generates plenty of coupon traffic, but its shoppers are far less likely to follow through. One possible explanation: Miami's heavy tourism economy means a significant share of web traffic comes from visitors rather than habitual local shoppers, inflating session counts without the corresponding intent to buy.
At the other end of the engagement spectrum, Philadelphia (51.5%) and San Francisco (52.1%) quietly outperform cities with far more traffic. Both sit outside the top 10 by volume but rank among the highest in copy rate, suggesting their coupon searchers are especially purposeful — when they look for a deal, they use it.
The cities that search for deals the least
If the top of the volume ranking is dominated by America's biggest metros, the bottom reveals something different: mid-size cities where coupon searching mycouponstock isn't as central to the shopping experience. These are cities with at least 10,000 sessions — enough to be statistically meaningful — but far less deal-seeking activity than their populations might suggest.
| RANK | CITY | SESSIONS | CODE COPIES | COPY RATE |
|---|---|---|---|---|
| 1 | Boise, ID | 10,591 | 12,949 | 52.4% |
| 2 | Chattanooga, TN | 11,556 | 12,281 | 48.2% |
| 3 | Knoxville, TN | 11,560 | 13,690 | 51.7% |
| 4 | El Paso, TX | 12,511 | 16,089 | 52.1% |
| 5 | Colorado Springs, CO | 12,525 | 15,549 | 53.0% |
| 6 | Providence, RI | 13,196 | 13,296 | 47.5% |
| 7 | Memphis, TN | 13,264 | 16,363 | 51.4% |
| 8 | Madison, WI | 13,279 | 15,288 | 50.3% |
| 9 | Cape Coral, FL | 13,393 | 13,466 | 46.6% |
| 10 | Syracuse, NY | 13,813 | 14,509 | 48.7% |
| 11 | Albuquerque, NM | 14,252 | 17,207 | 51.9% |
| 12 | Fresno, CA | 14,695 | 17,927 | 51.3% |
| 13 | Jersey City, NJ | 15,309 | 18,897 | 47.7% |
| 14 | Buffalo, NY | 15,977 | 17,120 | 47.5% |
| 15 | New Orleans, LA | 16,009 | 20,798 | 51.5% |
The most striking pattern here isn't which cities search the least — it's what happens when they do. Several of the lowest-volume cities are among the most deal-committed in the country. Boise (52.4%), Colorado Springs (53.0%), and El Paso (52.1%) all rank in the national top 10 by copy rate despite sitting near the bottom by volume. These cities don't generate a lot of coupon traffic, but when their residents do search for a deal, they almost always follow through.
Tennessee places three cities in the bottom 15 by volume — Chattanooga, Knoxville, and Memphis — but with a wide range in engagement. Memphis shoppers have a 51.4% copy rate, while Chattanooga's 48.2% copy rate is one of the lowest among any recognizable city. The state seems to produce pockets of intense deal-seekers alongside pockets of casual browsers.
The Northeast is notably represented at the bottom. Providence, Syracuse, Buffalo, and Jersey City all generate modest session volumes despite sitting in or near major metro areas. Providence and Buffalo both post copy rates below 48%, suggesting that in these markets, coupon searching is less embedded in the online shopping routine. Jersey City's presence is particularly interesting — sitting directly across the river from the nation's #1 city by volume, it generates just 3% of New York's traffic, likely because many of its residents are captured in New York's data through commuting and mobile network patterns.
Cape Coral, Florida follows a pattern we've seen with Miami: Florida cities that generate below-average coupon traffic and below-average copy rates. At 46.6% copy rate, Cape Coral's shoppers are among the least engaged in the study — browsing infrequently and rarely following through when they do.
The most deal-obsessed cities in America
Volume tells you where people shop. Copy rate tells you where people mean it. To find the most deal-obsessed cities in the country, we ranked every U.S. city with at least 10,000 coupon sessions by the percentage of visits where a shopper actually copied a promo code to use at checkout.
| RANK | CITY | COPY RATE | SESSIONS |
|---|---|---|---|
| 1 | Irvine, CA | 55.1% | 15,970 |
| 2 | San Antonio, TX | 53.2% | 35,794 |
| 3 | Colorado Springs, CO | 53.0% | 12,525 |
| 4 | Austin, TX | 52.7% | 58,591 |
| 5 | San Diego, CA | 52.5% | 64,077 |
| 6 | Boise, ID | 52.4% | 10,591 |
| 7 | Houston, TX | 52.3% | 128,650 |
| 8 | San Francisco, CA | 52.1% | 73,667 |
| 9 | El Paso, TX | 52.1% | 12,511 |
| 10 | Oklahoma City, OK | 52.0% | 20,788 |
| 11 | Albuquerque, NM | 51.9% | 14,252 |
| 12 | Fort Worth, TX | 51.8% | 34,215 |
| 13 | Knoxville, TN | 51.7% | 11,560 |
| 14 | Charlotte, NC | 51.6% | 61,708 |
| 15 | Nashville, TN | 51.6% | 37,601 |
Irvine, California is the most deal-obsessed city in America. More than 55% of coupon sessions in Irvine end with a code copied — nearly 5 percentage points above the national average and more than 11 points above the least engaged major metro, Miami. Irvine shoppers are also the most persistent: at 55.1% copy rate, they try more codes per visit than any other city in the top 50, suggesting they don't stop at the first result.
Texas places five cities in the top 15 — San Antonio, Austin, Houston, El Paso, and Fort Worth — more than any other state. The pattern is consistent: Texas shoppers don't just search for deals at high volume, they follow through at checkout at rates well above the national average. The one notable exception is Dallas, which despite being the 5th-largest city by coupon search volume, posts a copy rate of just 47.4% — nearly 6 points below San Antonio. The gap between these two Texas metros is one of the most striking findings in the data, and could reflect differences in the economic composition of each city's online shopping population.
The Sun Belt and Mountain West dominate the top 15. Beyond Texas, the list features Colorado Springs, Boise, Oklahoma City, Albuquerque, and El Paso — fast-growing cities across the southern and western U.S. where cost-of-living pressures may be driving more intentional deal-seeking behavior. Only two cities in the top 15 — San Francisco and Philadelphia (which narrowly missed at 51.5%) — sit in traditionally high-income coastal metros.
At the state level, a different picture emerges. New Jersey leads all states with 50,000+ sessions at a 52.3% copy rate, followed by Maryland (51.3%) and California (50.9%). Texas, despite its city-level dominance, ranks 8th among states at 49.6% — pulled down by Dallas and smaller metros that browse more than they buy. This suggests that Texas's deal obsession is concentrated in specific cities rather than spread evenly across the state.
The cities that punch above their weight: Deal-seeking per capita
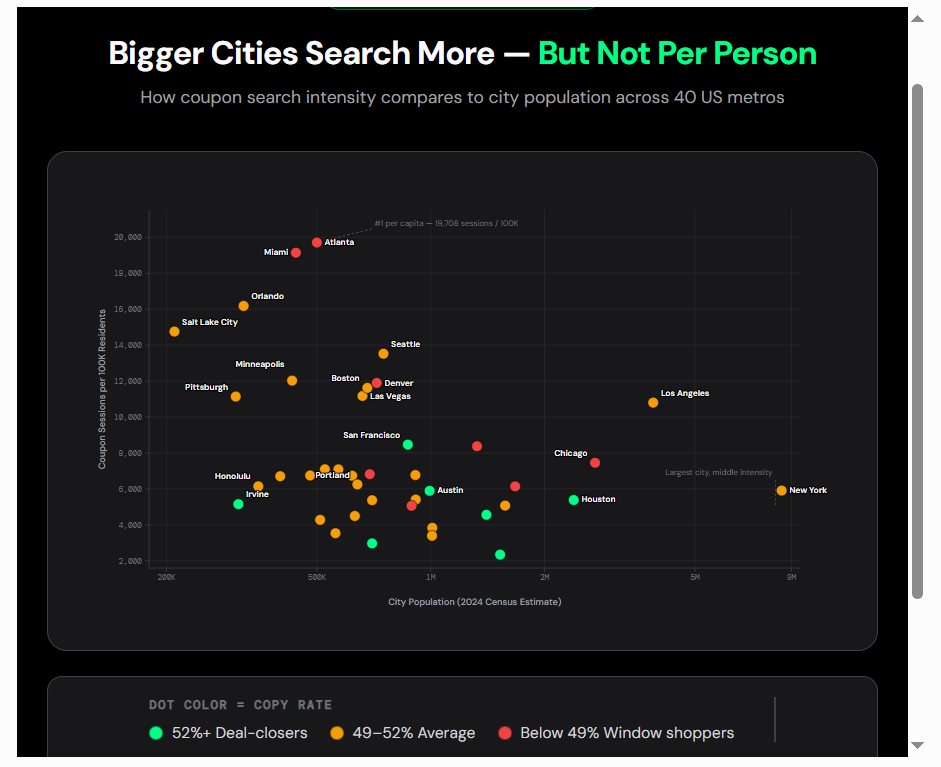
Raw session counts naturally favor the biggest cities — New York will always top a volume ranking. But when you adjust for population, a completely different picture emerges. To find out which cities are disproportionately deal-obsessed relative to their size, we calculated coupon sessions per 100,000 residents using the U.S. Census Bureau's Vintage 2024 population estimates (July 1, 2024).
The results flip the script on the volume rankings.
| RANK | CITY | SESSIONS PER 100K | POPULATION (2024) | TOTAL SESSIONS | COPY RATE |
|---|---|---|---|---|---|
| 1 | Atlanta, GA | 19,708 | 500,000 | 98,538 | 48.2% |
| 2 | Salt Lake City, UT | 14,756 | 210,000 | 30,988 | 51.5% |
| 3 | Seattle, WA | 13,524 | 750,000 | 101,431 | 50.3% |
| 4 | Denver, CO | 11,898 | 720,000 | 85,651 | 48.9% |
| 5 | Boston, MA | 11,624 | 680,000 | 79,041 | 49.8% |
| 6 | Las Vegas, NV | 11,175 | 660,000 | 73,756 | 50.9% |
| 7 | Los Angeles, CA | 10,802 | 3,878,704 | 418,966 | 49.1% |
| 8 | San Francisco, CA | 8,467 | 870,000 | 73,667 | 52.1% |
| 9 | Charlotte, NC | 6,773 | 911,000 | 61,708 | 51.6% |
| 10 | Portland, OR | 6,251 | 640,000 | 40,008 | 51.5% |
| 11 | Honolulu, HI | 6,144 | 350,000 | 21,505 | 50.5% |
| 12 | New York, NY | 5,909 | 8,478,072 | 500,998 | 51.3% |
| 13 | Austin, TX | 5,897 | 993,588 | 58,591 | 52.7% |
| 14 | Nashville, TN | 5,372 | 700,000 | 37,601 | 51.6% |
| 15 | Irvine, CA | 5,152 | 310,000 | 15,970 | 55.1% |
Atlanta leads the per-capita rankings by a wide margin, generating nearly 19,700 coupon sessions per 100,000 residents — almost double the rate of some larger cities. Atlanta didn't crack the top 10 by copy rate (48.2%), meaning its shoppers are prolific searchers but slightly less likely to follow through. The city's role as the economic hub of the Southeast, combined with a relatively compact city-proper population of around 500,000, drives its outsized per-capita numbers.
Salt Lake City, Seattle, Denver, and Las Vegas all generate deal-seeking traffic far out of proportion to their size. Salt Lake City, with a city-proper population of just 210,000, produces nearly 31,000 coupon sessions — roughly 14,756 per 100,000 residents. These are mid-size cities with young, digitally engaged populations and, in many cases, high costs of living that motivate active deal-seeking behavior.
San Francisco combines both intensity and follow-through. It ranks 2nd per capita and also posts a 52.1% copy rate, placing it in the top 10 on both the volume-adjusted and engagement rankings. Very few cities score high on both axes — San Francisco's combination of tech-savvy consumers and high living costs appears to produce shoppers who are both frequent and intentional in their coupon use.
Honolulu is the surprise entry. Hawaii's geographic isolation and high cost of goods may be driving residents to seek out online discounts at rates far exceeding what the city's modest population would suggest. At over 6,100 sessions per 100K residents, Honolulu generates deal-seeking activity comparable to cities five times its size.
The biggest cities drop in the per-capita rankings. New York falls from #1 by volume to #12 per capita. Houston, the #4 city by sessions, doesn't crack the per-capita top 15 at all — its massive 2.4 million population dilutes its deal-seeking rate. The same is true for Phoenix, Dallas, and Chicago. Population mycouponstock isn't a predictor of per-capita deal obsession; cost of living and digital engagement appear to matter more.
The least deal-obsessed cities in America
Not every city that searches for coupons actually uses them. To find America's least deal-committed cities, we ranked metro areas with at least 20,000 coupon sessions by the percentage of visits that ended without a single code copied. These are the cities where shoppers browse deals but don't follow through.
| RANK | CITY | COPY RATE | SESSIONS |
|---|---|---|---|
| 50 | Miami, FL | 43.7% | 84,230 |
| 49 | Newark, NJ | 46.6% | 24,872 |
| 48 | Dallas, TX | 47.4% | 111,104 |
| 47 | San Jose, CA | 48.1% | 80,332 |
| 46 | Cleveland, OH | 48.1% | 21,039 |
| 45 | Washington, DC | 48.2% | 47,069 |
| 44 | Atlanta, GA | 48.2% | 98,538 |
| 43 | Birmingham, AL | 48.3% | 22,312 |
| 42 | Virginia Beach, VA | 48.3% | 20,540 |
| 41 | Chicago, IL | 48.7% | 202,929 |
Miami is the least deal-obsessed major city in America, and it isn't particularly close. At 43.7%, Miami's copy rate sits nearly 3 full percentage points below the next-lowest city with comparable volume (Newark at 46.6%) and a striking 12% below the national leader, Irvine. More than half of all Miami coupon sessions end without the shopper copying a single code. The city's tourism-heavy economy offers one explanation: a significant share of Miami's web traffic likely comes from visitors and seasonal residents who browse casually rather than shop with intent. Miami also has one of the highest international visitor volumes of any U.S. city, which may inflate session counts without corresponding purchase behavior.
Dallas is the most surprising name on this list. As we noted in Section 2, Dallas is the odd one out in Texas — the only major Texas city with a copy rate below the national average. Houston (52.3%), San Antonio (53.2%), Austin (52.7%), El Paso (52.1%), and Fort Worth (51.8%) all rank well above average. Dallas, despite being the 5th-largest city by coupon search volume, converts at just 47.4%. The city's higher median household income ($63,000 vs. San Antonio's $54,000) could suggest a less price-sensitive consumer base, but the gap with neighboring Fort Worth — just 30 miles away yet 4.4 percentage points higher in copy rate — is harder to explain by economics alone.
Washington, D.C. and Atlanta share a pattern: high traffic, modest follow-through. Both cities generate enormous coupon search volume relative to their size (Atlanta ranks #1 per capita), but their copy rates sit below the national average at 48.2%. These are cities dominated by professional, white-collar workforces where deal-seeking may be more aspirational than habitual — shoppers check for deals but don't necessarily need them to complete a purchase.
Device mix doesn't explain the gap. One hypothesis was that low-copy-rate cities might have disproportionately mobile traffic, since mobile shoppers are often browsing rather than buying. But the data doesn't support this cleanly. Miami's mobile share (58%) is nearly identical to New York's (57.5%) and Houston's (58.4%), yet those cities post copy rates 7 to 9 points higher. San Antonio has the highest mobile share of any top city at 68.4% and still ranks #2 in copy rate nationally. Whatever drives Miami's low engagement, it isn't the device — it appears to be something about the shoppers themselves.
The broader Rust Belt and Mid-Atlantic appear throughout the bottom. Cleveland (48.1%), Newark (46.6%), Virginia Beach (48.3%), and Birmingham (48.3%) round out the least-engaged cities. These metros share some common traits: older populations, lower rates of e-commerce adoption in some demographics, and in Newark's case, possible spillover traffic from the broader New York metro area that doesn't represent local shopping intent.
What deal-seeking behavior reveals about American shopping
This study started with a simple question: where do Americans hunt for deals the hardest? The answer turned out to be more nuanced than a population ranking.
Volume is driven by population — New York, Los Angeles, and Chicago will always top that list. But engagement tells a different story. The cities where shoppers actually follow through at checkout are overwhelmingly in the Sun Belt and Mountain West: San Antonio, Austin, Houston, Irvine, Oklahoma City, Boise, Colorado Springs. These are fast-growing cities where cost-of-living pressures are real but not yet crushing, and where a digitally fluent population treats coupons as a routine part of online shopping rather than a last resort.
The per-capita rankings reveal yet another layer. Atlanta, Salt Lake City, and Seattle generate deal-seeking traffic far out of proportion to their size, suggesting that city culture and economic conditions matter more than population. And Honolulu's appearance near the top — driven by the high cost of imported goods on an island 2,400 miles from the mainland — is a reminder that geography still shapes how Americans spend.
At the other end, Miami stands alone as the most disengaged major metro. Its 43.7% copy rate sits nearly 10 percentage points below cities of comparable size, a gap that tourism-driven traffic and a transient population can only partially explain. Dallas's low ranking among Texas cities raises similar questions about what separates a deal-committed shopper from a casual browser.
The national average copy rate of 50.7% means that roughly half of all American coupon searches end with a code in hand. That's a remarkably high conversion rate for a free, zero-commitment action — and it suggests that the majority of people searching for deals are doing so with genuine purchase intent, not idle curiosity. The cities that exceed that benchmark aren't just bargain-hunting; they're completing a transaction ritual that has become a defining feature of American e-commerce.
Methodology
All data in this study comes from mycouponstock web analytics (GA4), covering coupon search sessions on mycouponstock.com merchant pages. 12.4 million coupon sessions across more than 10,000 U.S. cities, generated by approximately 9 million unique users. Distinct browsing sessions (unique combinations of anonymous user ID and session ID) on mycouponstock merchant coupon pages, filtered to U.S. traffic with a valid city-level geolocation.
Minimum thresholds: Cities were included in the ranked tables if they met the following session minimums: top and bottom cities by volume (10,000+ sessions among recognizable U.S. cities), most and least deal-obsessed by copy rate (10,000+ sessions for the engagement ranking, 20,000+ sessions for the major metro ranking). Higher thresholds were used for engagement rankings to ensure statistical reliability.
Per-capita calculations: Sessions per 100,000 residents were calculated using U.S. Census Bureau Vintage 2024 population estimates (July 1, 2024) for city-proper populations. Note that city-proper boundaries vary significantly — some cities (e.g., Jacksonville, Nashville) encompass a larger share of their metro area than others (e.g., Atlanta, Salt Lake City), which can inflate or deflate per-capita figures. Per-capita rankings should be interpreted with this caveat in mind.
Exclusions: Two cities — Ashburn, Virginia and Cheney, Kansas — were excluded from all rankings due to anomalous traffic patterns consistent with data center or VPN-routed traffic (extremely high session counts with abnormally low copy rates). Cities labeled "(not set)" in geolocation data were also excluded. For the "Cities That Search the Least" section, small towns with disproportionately high session counts relative to their populations (suggesting ISP routing artifacts) were excluded in favor of recognizable U.S. cities.
Limitations: This study measures deal-seeking behavior on mycouponstock.com specifically and does not capture coupon activity on other platforms, direct retailer sites, or offline couponing. Copy rate is a proxy for intent, not a confirmed measure of actual coupon redemption at checkout. Geographic attribution relies on GA4's IP-based geolocation, which may occasionally misattribute users — particularly those using VPNs or mobile networks.